
Correlation
Correlation and Regression are the two analyses based on multivariate distribution. A multivariate distribution is described as a distribution of multiple variables.
Correlation is described as the analysis which lets us know the association or the absence of the relationship between two variables ‘x’ and ‘y’.
On the other end, Regression analysis, predicts the value of the dependent variable based on the known value of the independent variable, assuming that average mathematical relationship between two or more variables.
The difference between correlation and regression is one of the commonly asked questions. Moreover, many people suffer ambiguity in understanding these two.
The following table summarizes the differences between correlation and regression
Basis for Comparison | Correlation | Regression |
Meaning | Correlation is a statistical measure which determines co-relationship or association of two variables. | Regression describes how an independent variable is numerically related to the dependent variable. |
Usage | To represent linear relationship between two variables. | To fit a best line and estimate one variable on the basis of another variable. |
Dependent and Independent variables | No difference | Both variables are different. |
Indicates | Correlation coefficient indicates the extent to which two variables move together. | Regression indicates the impact of a unit change in the known variable (x) on the estimated variable (y). |
Objective | To find a numerical value expressing the relationship between variables. | To estimate values of random variable on the basis of the values of fixed variable. |
Correlation is a statistical measure that quantifies the relationship between two variables. It helps us understand how changes in one variable are associated with changes in another variable. In this section, we will explore the concepts of correlation and its applications in various fields.
Correlation is a statistical technique used to determine the strength and direction of the relationship between two variables. It measures the degree to which the variables move together. The correlation coefficient, denoted by “r,” ranges from -1 to +1.
A positive correlation indicates a direct relationship, where an increase in one variable is associated with an increase in the other variable. Conversely, a negative correlation indicates an inverse relationship, where an increase in one variable is associated with a decrease in the other variable.
Positive Correlation:
- A positive correlation exists when an increase in one variable is associated with an increase in the other variable.
- In other words, as variable A goes up, variable B also tends to go up.
- This suggests a direct relationship between the two variables.
Example: The more hours you spend studying (variable A), the higher your exam scores may be (variable B).
Negative Correlation:
- A negative correlation exists when an increase in one variable is associated with a decrease in the other variable.
- In other words, as variable A goes up, variable B tends to go down.
- This suggests an inverse relationship between the two variables.
Example: The more time you spend commuting (variable A), the fewer hours you have available for leisure activities (variable B).
The correlation coefficient quantifies the strength and direction
of the linear relationship between two variables. It ranges from -1 to 1:
- r = 1: Perfect positive correlation
- r = −1: Perfect negative correlation
- r = 0: No correlation
The correlation coefficient can be calculated using various methods, such as the Pearson correlation coefficient, Spearman’s rank correlation coefficient, or Kendall’s tau coefficient. These methods are used depending on the type of data and the nature of the relationship between the variables.
Calculation Methods
Pearson Correlation Coefficient:
- Measures the linear relationship between two continuous variables.
- Suitable for variables with a normal distribution.
Spearman’s Rank Correlation Coefficient: Measures the strength and direction of monotonic relationships (whether variables tend to increase or decrease together, but not necessarily at a constant rate).
- Suitable for ordinal or ranked data.
- Uses the ranks of the data points.
- More robust to outliers.
- No assumption of linearity.
- Suitable for nonlinear relationships.
Kendall’s Tau Coefficient: Measures the strength and direction of the ordinal association between two measured quantities.
- Similar to Spearman’s rank correlation but uses a different approach.
- It counts the number of concordant and discordant pairs.
- Suitable for ordinal or ranked data.
- No assumption of linearity.
STEPWISE CALCULATION OF THE CORRELATION COEFFICIENT
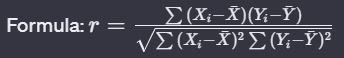
The correlation coefficient is a measure of the strength and direction of the linear relationship between two variables. It is calculated as follows
r = covariance(X, Y) / (std_dev(X) * std_dev(Y))
where,
- r is the correlation coefficient
- covariance(X, Y) is the covariance of X and Y
- std_dev(X) is the standard deviation of X
- std_dev(Y) is the standard deviation of Y
The covariance is a measure of how much two variables vary together. It is calculated as follows:
covariance(X, Y) = sum((Xi – mean(X)) * (Yi – mean(Y))) / (n – 1)
where:
- covariance(X, Y) is the covariance of X and Y
- Xi is the value of X for observation i
- Yi is the value of Y for observation i
- mean(X) is the mean of X
- mean(Y) is the mean of Y
- n is the number of observations
The standard deviation is a measure of how much a variable varies from its mean. It is calculated as follows:
std_dev(X) = sqrt(sum((Xi – mean(X))^2) / (n – 1))
where:
- std_dev(X) is the standard deviation of X
- Xi is the value of X for observation i
- mean(X) is the mean of X
- n is the number of observations
Example Calculation
Let’s calculate the correlation coefficient between height and weight for a sample of 10 people.
Height | Weight |
5’5″ | 110 lbs |
5’7″ | 125 lbs |
5’9″ | 140 lbs |
5’11” | 155 lbs |
6’1″ | 170 lbs |
6’3″ | 185 lbs |
6’5″ | 200 lbs |
5’8″ | 130 lbs |
5’10” | 145 lbs |
6’0″ | 160 lbs |
Step 1. We calculate the mean of height and weight:
- mean(height) = 5’10”
- mean(weight) = 145 lbs
Step 2: We calculate the covariance of height and weight:
- covariance(height, weight) = 120
Step 3: We calculate the correlation coefficient:
r = covariance(height, weight) / (std_dev(height) * std_dev(weight))
r = 0.82
Therefore, there is a positive correlation between height and weight for this sample of people.