
Normal Distribution
I. Characteristics and Properties of Normal Distribution
The normal distribution, also known as the Gaussian distribution or bell curve, is one of the most important probability distributions in statistics. It is widely used in various fields of research, including biology, economics, psychology, and physics. In this section, we will explore the properties of the normal distribution and understand its significance in research.
The normal distribution is defined by the following probability density function:
f(x) = (1/(σ√(2π))) * e^(-1/2*(x-μ)2/σ2)
Where:
μ is the mean of the distribution
σ is the standard deviation of the distribution
pi is the mathematical constant approximately equal to 3.14
Breaking this down:
(1) The term (1/(σ√(2π))) is a normalization constant, to ensure the total integrated probability is 1.
(2) e raised to the power of the exponent (-1/2*(x-μ)2/σ2) is the term that generates the bell curve shape of the normal distribution.
Specifically:
- (x – μ) is the deviation of the random variable x from the mean μ
- (x-μ)2 gives the squared deviation
- Dividing by σ2 spreads the distribution out by the variance
- The -1/2 term helps further shape the distribution
So in plain language, this function calculates the probability density at each point x by taking an exponential function of the squared deviation from the mean, normalized by the standard deviation. The parameters μ and σ determine the center and width of the distribution.
Characteristics of the Normal Distribution
The normal distribution is characterized by its bell-shaped curve, which is symmetric and centered around its mean. It is defined by two parameters: the mean (μ) and the standard deviation (σ). The mean represents the center of the distribution, while the standard deviation measures the spread or dispersion of the data points around the mean.
Symmetry: The normal distribution is symmetric, meaning that the left and right halves of the curve are mirror images of each other. This symmetry indicates that the mean, median, and mode of the distribution are all equal.
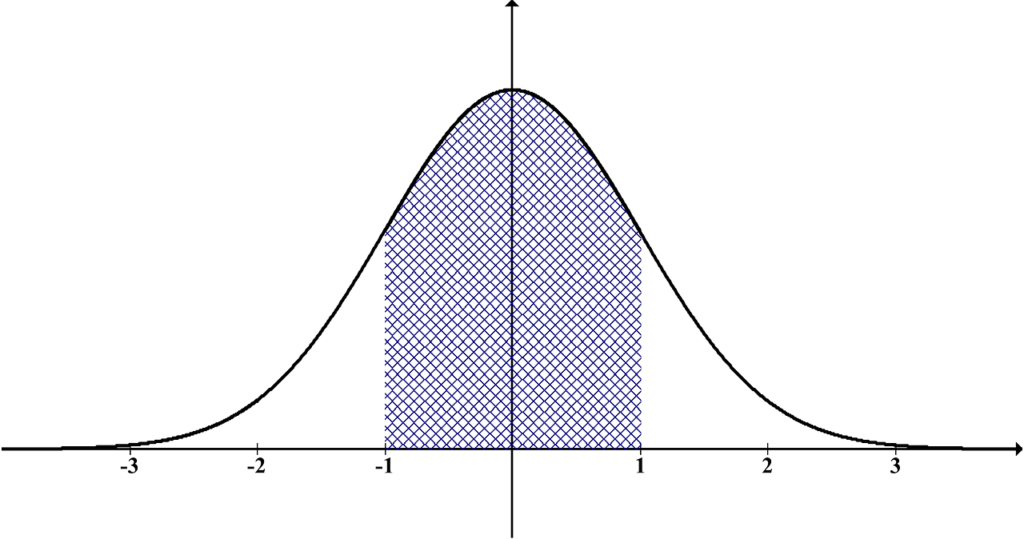
Bell-shaped curve: The shape of the normal distribution resembles a bell, with the majority of the data points concentrated around the mean. As we move away from the mean, the number of data points gradually decreases, forming the tails of the distribution.
Empirical Rule: The normal distribution follows the empirical rule, also known as the 68-95-99.7 rule. According to this rule, approximately 68% of the data falls within one standard deviation of the mean, 95% falls within two standard deviations, and 99.7% falls within three standard deviations.
Z-Score: The z-score is a measure of how many standard deviations a particular data point is away from the mean. It is calculated by subtracting the mean from the data point and dividing the result by the standard deviation. The z-score allows us to compare data points from different normal distributions.
Properties of the Normal Distribution
Central Limit Theorem: One of the most important properties of the normal distribution is the Central Limit Theorem (CLT). According to the CLT, the sum or average of a large number of independent and identically distributed random variables will be approximately normally distributed, regardless of the shape of the original distribution. This property makes the normal distribution a fundamental tool in statistical inference.
Standardization: The normal distribution can be standardized using the z-score. By standardizing the data, we can compare and analyze values from different normal distributions. Standardization transforms the data into a standard normal distribution with a mean of 0 and a standard deviation of 1.
Probability Density Function: The probability density function (PDF) of the normal distribution is given by the formula:
where f(x) represents the probability density at a given value x, μ is the mean, and σ is the standard deviation. The PDF allows us to calculate the probability of a data point falling within a specific range.
Standard Normal Distribution: The standard normal distribution is a special case of the normal distribution with a mean of 0 and a standard deviation of 1. It is often denoted as Z ~ N(0, 1). By using tables or statistical software, we can calculate probabilities and percentiles for the standard normal distribution.
II. Applications of Normal Distribution
The normal distribution, also known as the Gaussian distribution or bell curve, is one of the most important probability distributions in statistics. It is a continuous probability distribution that is symmetric and bell-shaped. In this section, we will explore the applications of the normal distribution in various fields of research.
Z-Scores and Standardization
One of the key applications of the normal distribution is in standardizing data using z-scores. A z-score measures the number of standard deviations a particular data point is from the mean of a distribution. By standardizing data, we can compare values from different distributions and determine their relative positions. This is particularly useful in hypothesis testing and determining confidence intervals.
Central Limit Theorem
The central limit theorem is a fundamental concept in statistics that states that the distribution of sample means, regardless of the shape of the population distribution, approaches a normal distribution as the sample size increases. This theorem has wide-ranging applications in research, as it allows us to make inferences about a population based on a sample.
For example, let’s say we are interested in studying the average height of a population. By taking multiple random samples and calculating the sample means, we can create a distribution of sample means. According to the central limit theorem, this distribution will be approximately normal, even if the population distribution is not.
Hypothesis Testing
Hypothesis testing is a statistical method used to make inferences about a population based on sample data. The normal distribution plays a crucial role in hypothesis testing, particularly when dealing with large sample sizes.
In hypothesis testing, we compare the observed sample statistic to the expected value under the null hypothesis. By assuming that the sample statistic follows a normal distribution, we can calculate the probability of observing a value as extreme as the one obtained from the sample. This probability, known as the p-value, helps us make decisions about the null hypothesis.
Confidence Intervals
Confidence intervals are used to estimate the range of values within which a population parameter is likely to fall. The normal distribution is often employed in calculating confidence intervals, especially when dealing with large sample sizes.
By assuming that the sample mean follows a normal distribution, we can calculate the margin of error and construct a confidence interval around the sample mean. This interval provides a range of values within which we can be confident that the population mean lies.
Quality Control
The normal distribution is widely used in quality control processes to monitor and control the variability of a product or process. By collecting data and plotting it on a control chart, deviations from the expected mean and standard deviation can be detected.
For example, in manufacturing, the normal distribution is used to monitor the quality of products by measuring characteristics such as length, weight, or diameter. Deviations from the expected values can indicate issues in the production process and prompt corrective actions.
Risk Assessment
Risk assessment is an important aspect of many fields, including finance, insurance, and environmental science. The normal distribution is often used to model and analyze risks.
In finance, for instance, the normal distribution is employed to model stock returns and calculate the probability of extreme events. This information is crucial for portfolio management and risk mitigation strategies.
Biostatistics
In the field of biostatistics, the normal distribution is frequently used to analyze and interpret biological data. It is employed in various applications, such as analyzing the distribution of body measurements, assessing the effectiveness of drugs, and studying the prevalence of diseases.
For example, in clinical trials, the normal distribution is used to analyze the efficacy of a new drug by comparing the treatment group to the control group. By assuming that the response variable follows a normal distribution, statistical tests can be conducted to determine if the drug has a significant effect.
Educational Assessment
In educational assessment, the normal distribution is often used to analyze test scores and evaluate student performance. By assuming that test scores follow a normal distribution, various statistical measures can be calculated, such as percentiles and standard scores.
These measures help educators understand how students perform relative to their peers and set appropriate grading criteria. Additionally, the normal distribution is used to establish norms and standards for educational assessments.
Social Sciences
The normal distribution is widely used in the social sciences to analyze and interpret data. It is employed in fields such as psychology, sociology, and economics to study various phenomena.
For example, in psychology, the normal distribution is used to analyze personality traits, intelligence scores, and psychological test results. By assuming that these variables follow a normal distribution, researchers can make statistical inferences and draw conclusions about the population.
In conclusion, the normal distribution has numerous applications in research across various disciplines. From hypothesis testing to quality control, risk assessment to educational assessment, the normal distribution provides a powerful tool for analyzing and interpreting data. Understanding its properties and applications is essential for researchers utilizing computers in their research endeavors.